Nuant
- Company
- Nuant
- Team
- Design, Product, Engineering
The product
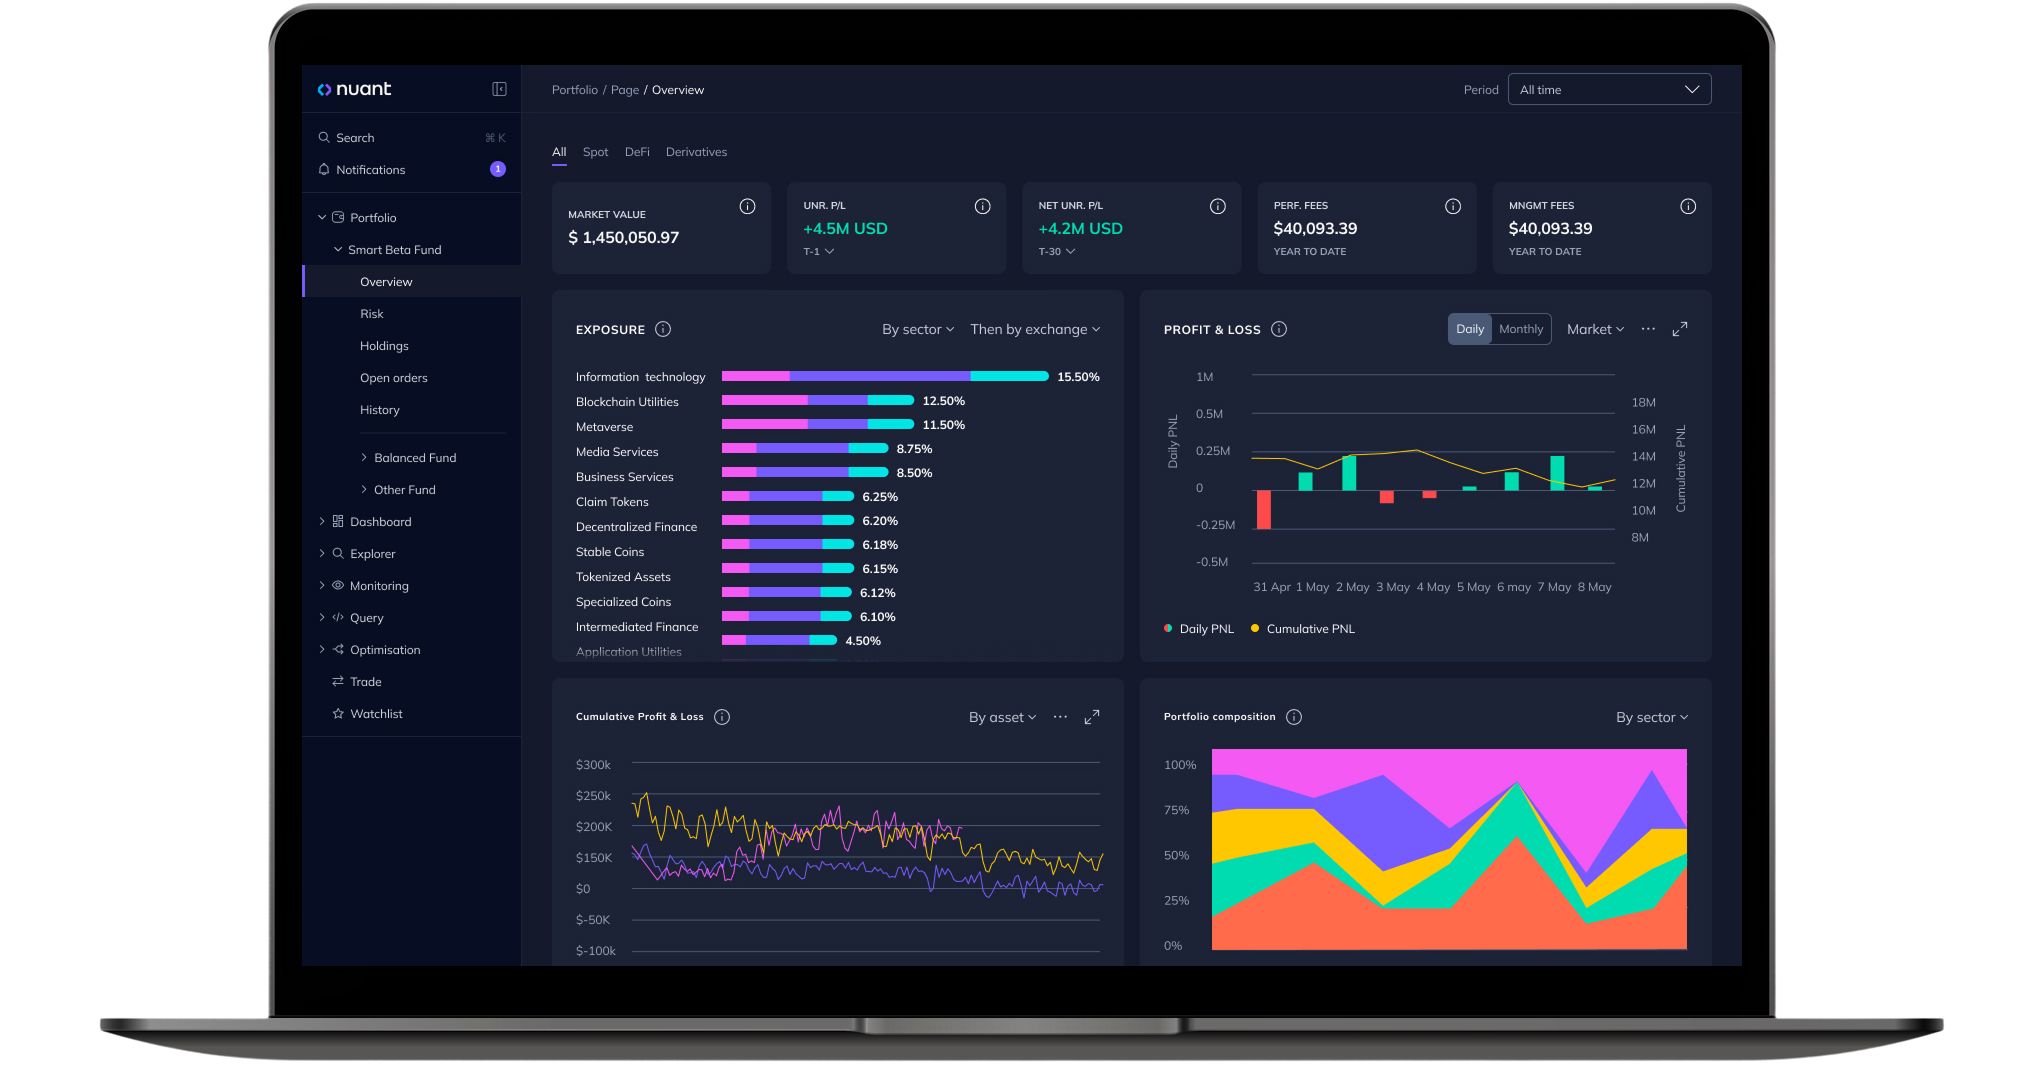
At the time, an institutional fund running crypto strategies was still tracking positions across dozens of exchanges, custodians, wallets, and DeFi protocols in spreadsheets. There was no single view, no live risk read, and no shared spine between portfolio management and quant research. Nuant was built to close that gap.
Two product lines. The Portfolio Management System brought spot, derivatives, DeFi, private equity, SAFTs, and SAFEs into one surface across 30+ exchanges, 50+ blockchains, 7 custodians, and 400+ DeFi protocols. The Nuant Quantitative System is a web IDE built on VS Code for data applications on blockchain data, with simulation to stress and refine on-chain strategies.
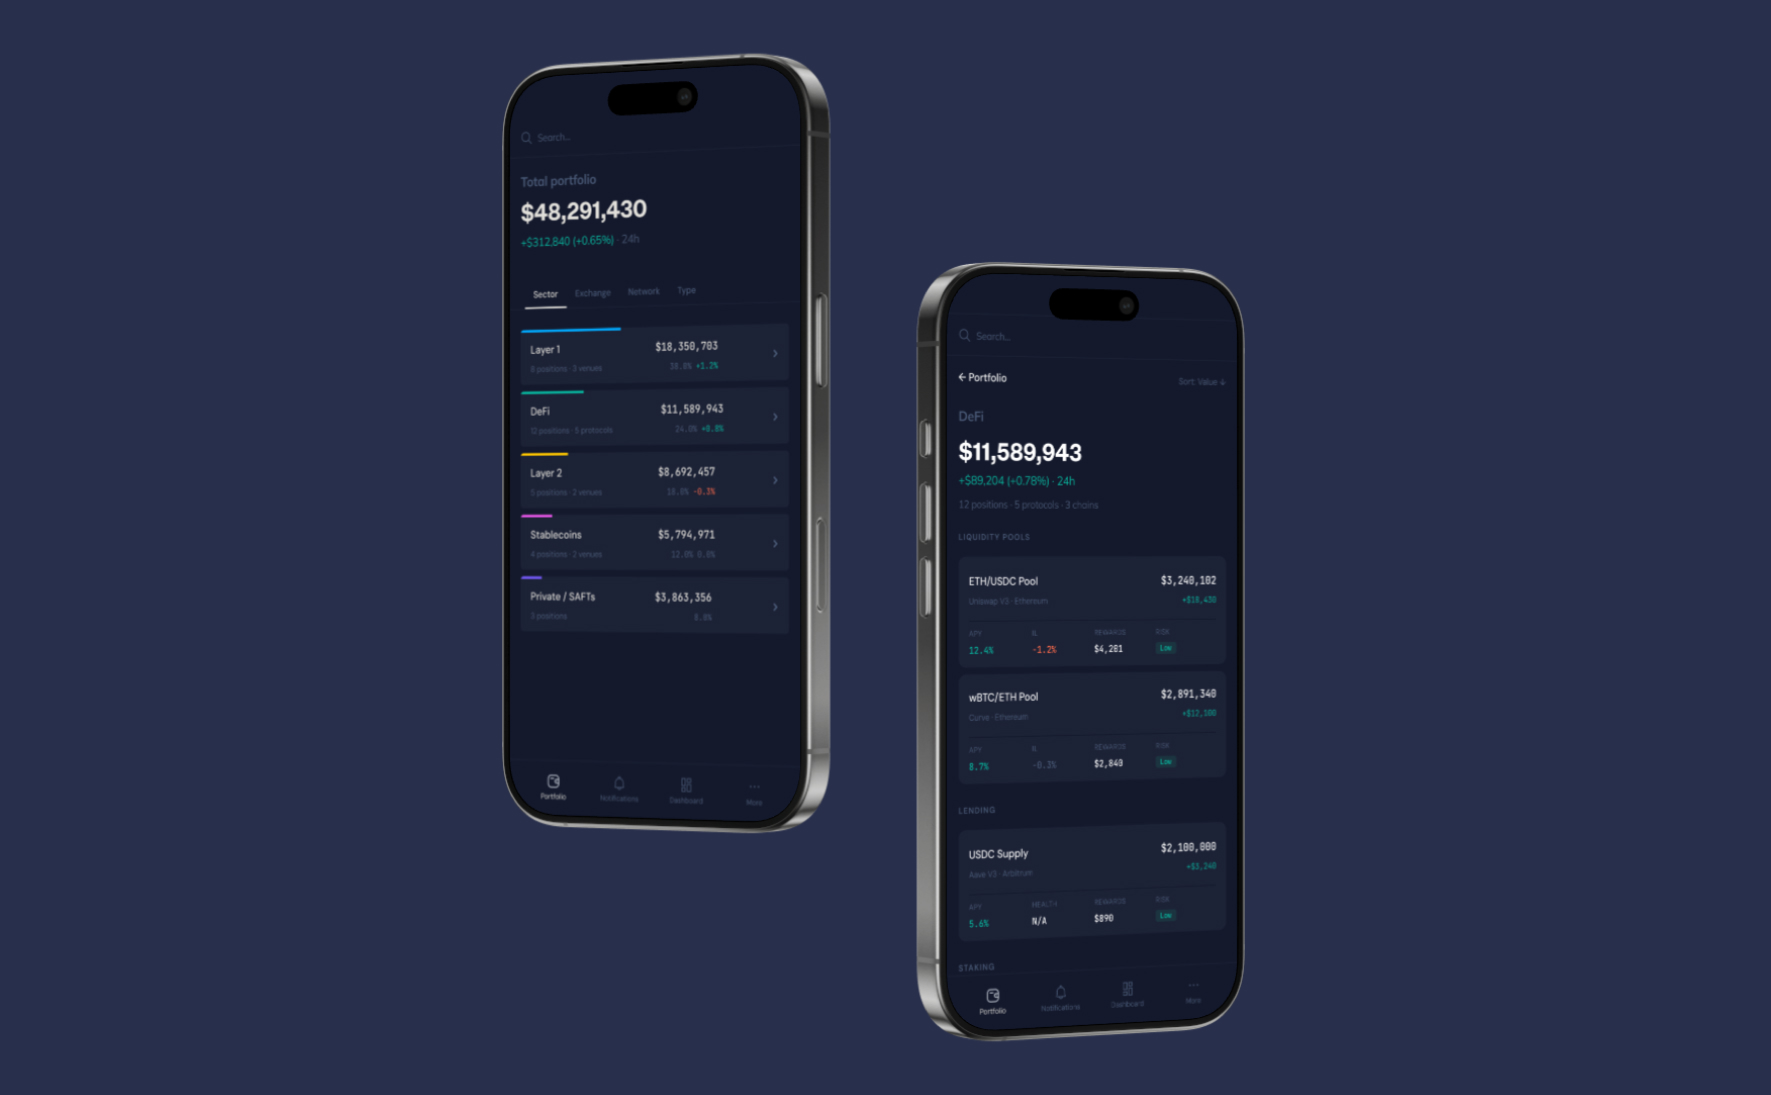
The PMS had to be reliable and legible across devices. Crypto markets do not close, and portfolio managers need the same read on exposure, risk, and structure whether they are at a desk or away from it.
The design challenge
Portfolio managers and quant analysts often sit in the same organisation and touch the same books, but they want opposite tools. PMs want a dashboard they can scan in a few seconds. Quants want a deep code environment and full control of inputs. The portfolios overlap; the mental model of the interface does not.
For PMs it also had to be credible outside long analysis sessions: not a read only shadow, but a surface they can trust for a quick check and triage.
Key design decisions
01The single screen portfolio, from overview to deep dive
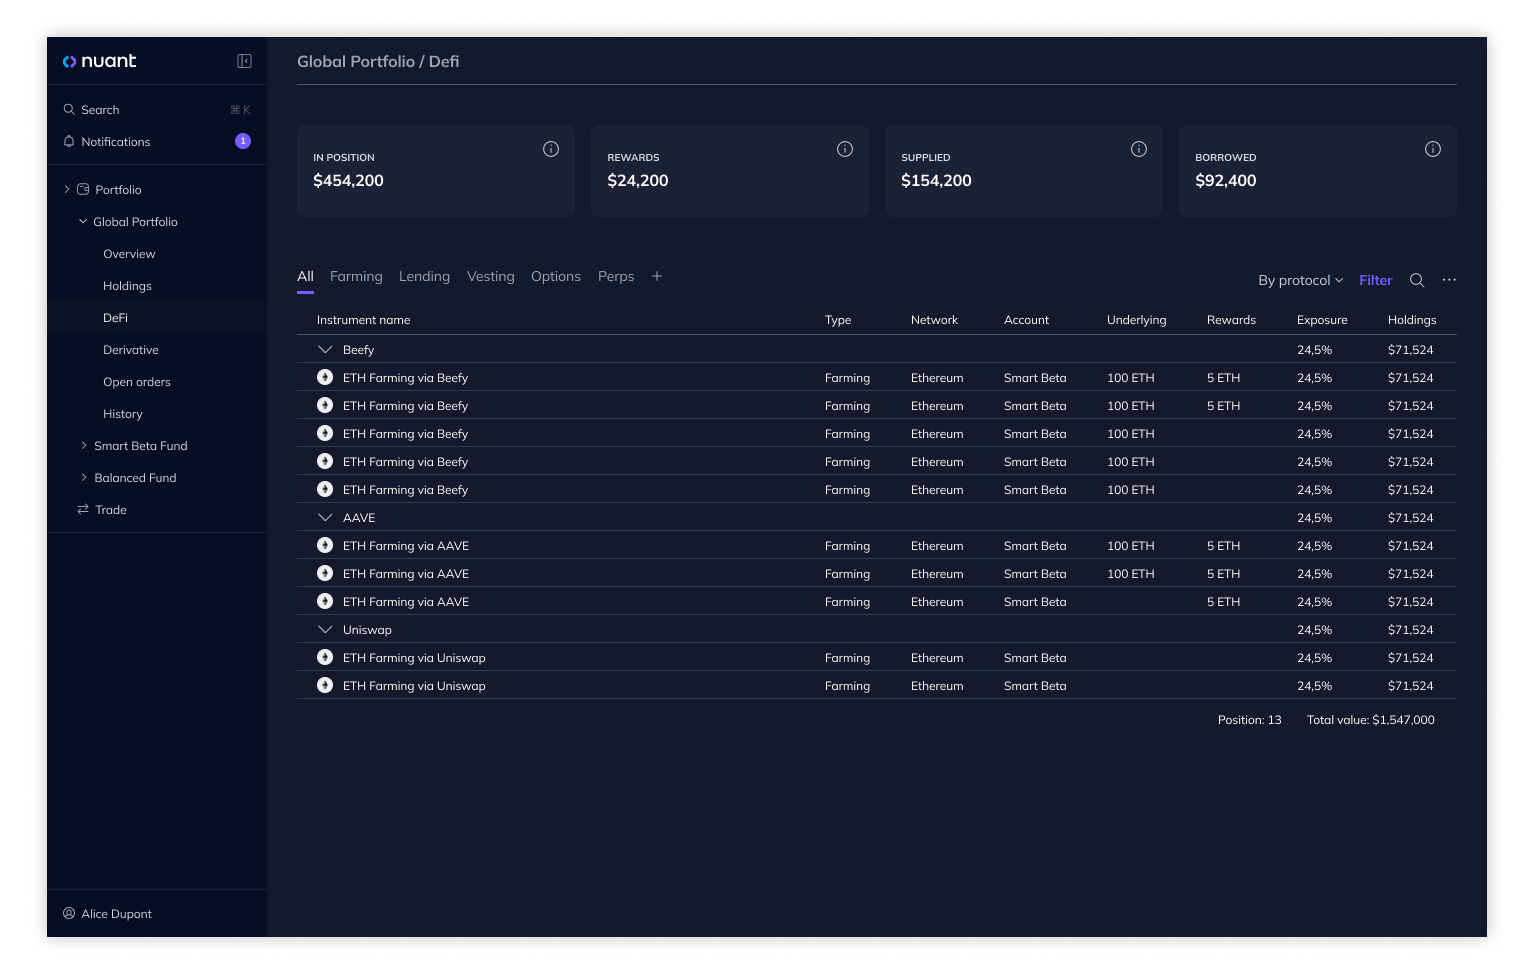
A fund on Nuant might hold spot on three exchanges, perps on two more, liquidity positions across several DeFi protocols, staked assets on multiple chains, and SAFTs, all at once. The story was one interface for all of it. The hard part was keeping that story from turning into noise on a thirty two inch screen or in a quick check on the go.
We built the view around exposure groups. Instead of a flat list sorted by value, holdings roll up by account, sector, network, or asset type, and the user chooses the lens. Each group shows its own aggregates before you open individual lines. For DeFi, balance, yield, rewards, and pool composition stay visible inline instead of hiding behind another screen.
Grouping is what made the interface workable across contexts. We did not try to force the full table everywhere at once. You get a legible summary first (exposure by sector or by venue), then you drill in. The flow supports both a fast scan and a detailed investigation when something looks off.
02From fragmented data to trusted positions
Most teams do not start with a portfolio problem. They start with a data problem: exchange fills in one format, custodians in another, wallets on-chain, DeFi positions with their own mechanics, and market data coming from elsewhere. If those feeds do not reconcile into a consistent ledger, every dashboard becomes an argument.
Nuant’s approach was to treat aggregation and normalization as a first class product surface, not plumbing. We designed for clear provenance (where a number came from), predictable transformations (how it was derived), and fast ways to spot drift between sources. Once the spine is trustworthy, portfolio, analytics, monitoring, and decision support can all sit on top of it without each team rebuilding their own truth.
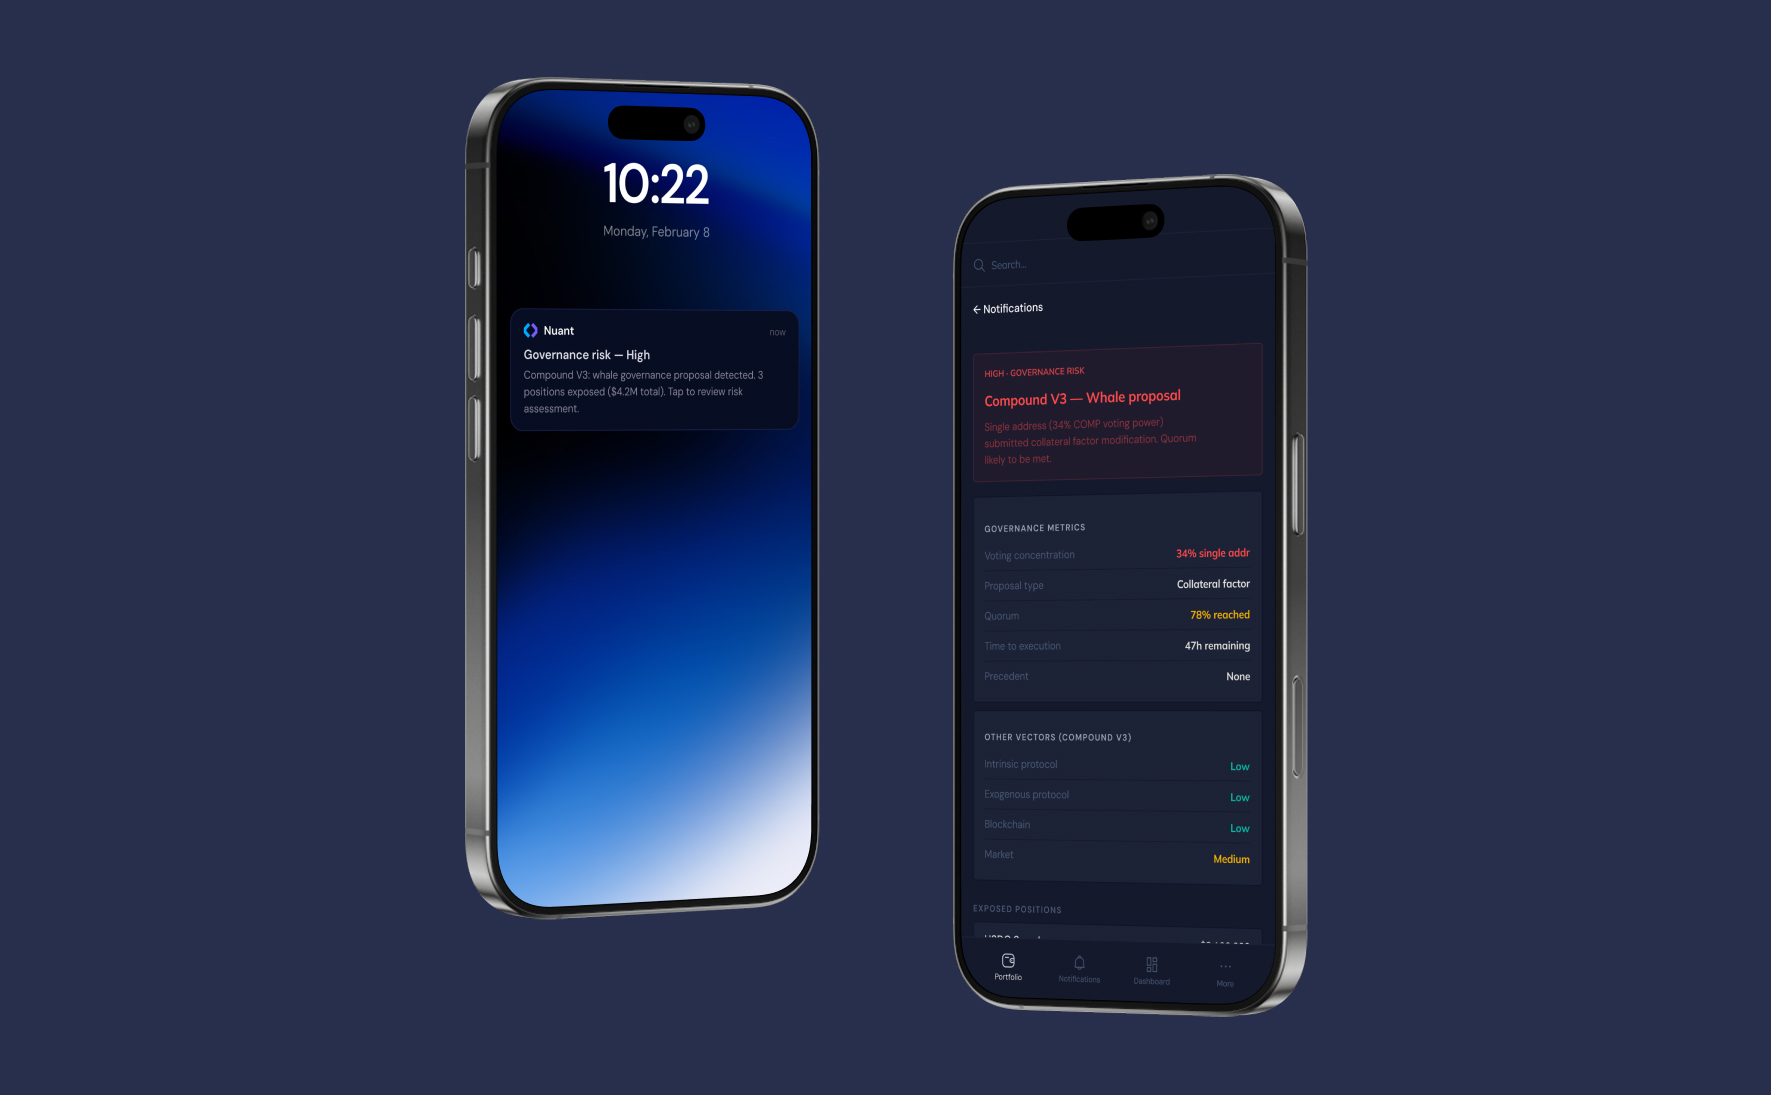
Risk still mattered, but as one layer of insight rather than the product’s identity. We kept the model multi-dimensional so a governance issue does not read like a market move, and we made it easy to connect an alert back to the underlying positions and data that produced it.
03Two products, one design language
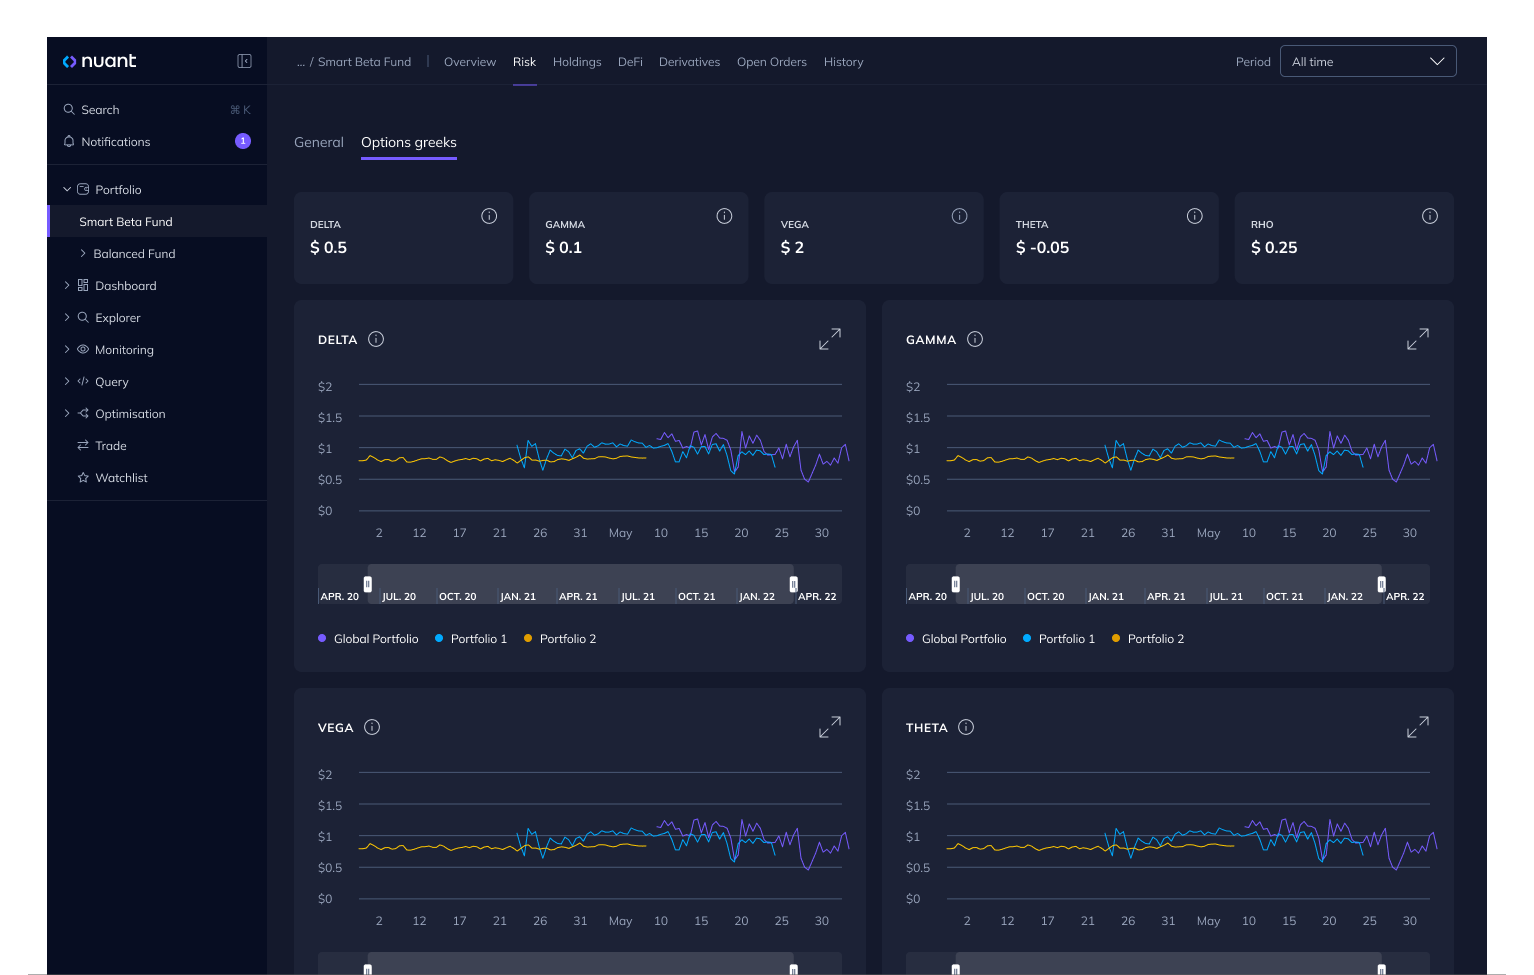
The PMS and NQS grew from different teams and different habits: a visual dashboard on one side, a code IDE on the other. They shared a data layer but little else, so a PM who wanted the quant story behind a risk line had to jump between two unrelated surfaces.
We tied the architecture so the products reference each other. Simulations in NQS can pull real positions from the PMS. Risk metrics from the quant layer appear in the portfolio with provenance: computed in NQS, with these parameters, at this time. PMs can consume quant outputs inside the portfolio flow without having to live in the IDE.
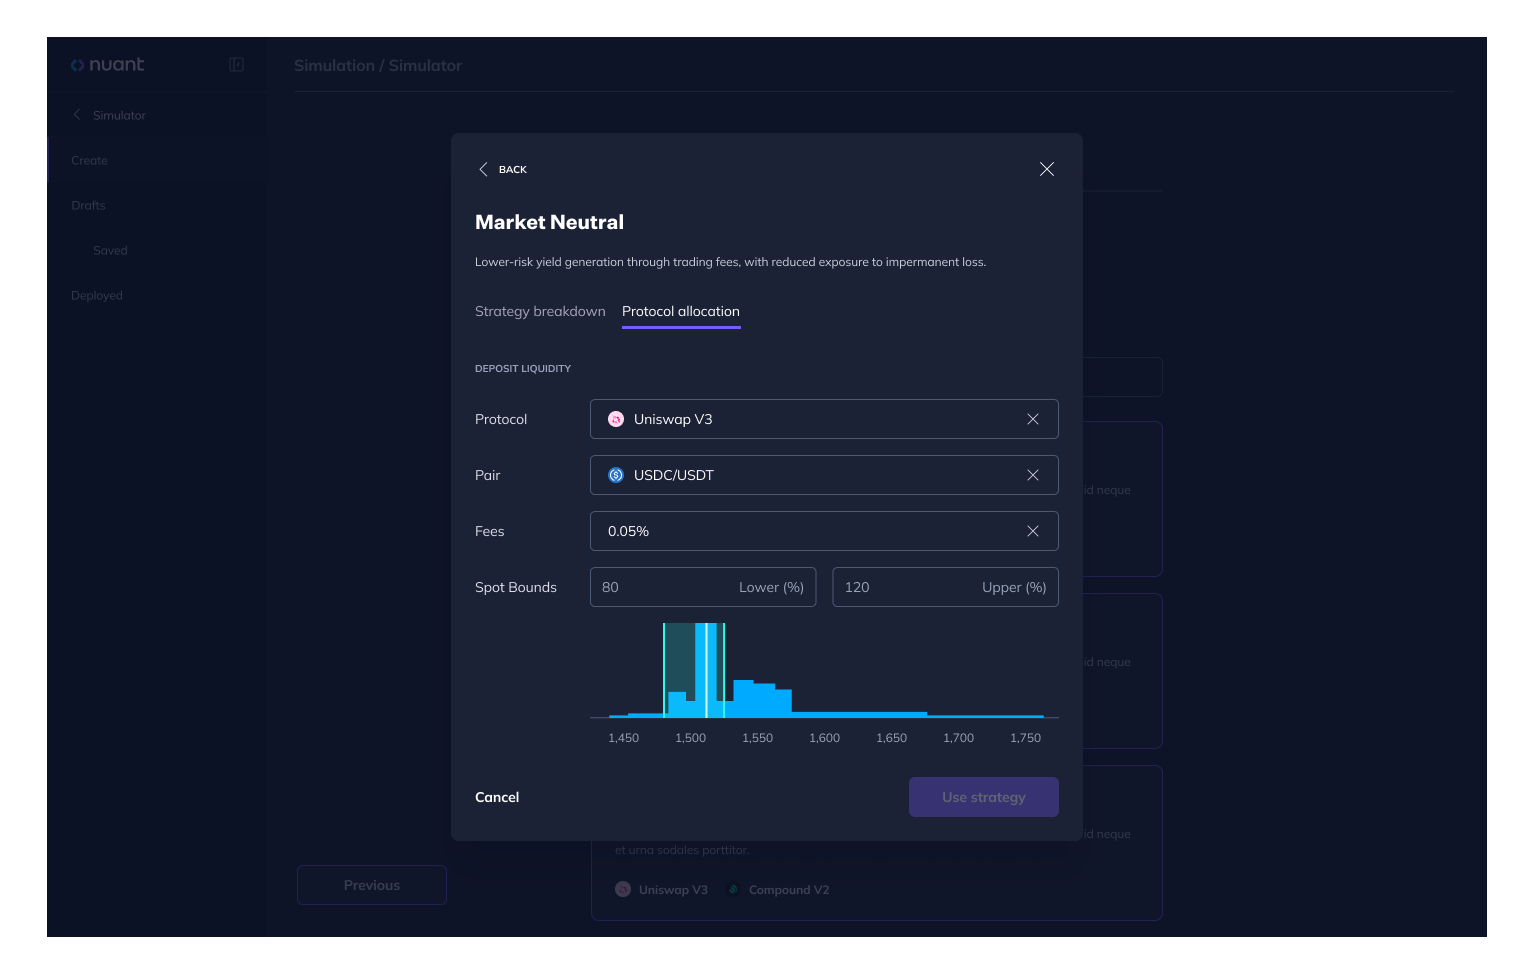
For the simulation engine we opened two paths: a guided Strategy Builder for people who think in outcomes, and a full parameter workbench for people who think in inputs. Same engine underneath, comparable outputs. The split is not about ability; it is about how people frame the task. A single difficulty slider would have satisfied neither group.
We aligned type, color, data states, and interaction habits so moving between dashboard and IDE feels like moving between rooms in one product, not switching applications.
What I took away
The calls that lasted at Nuant were mostly structural: treat data aggregation and normalization as a product (not a back office task), connect portfolio state to quant analysis instead of treating them as silos, and keep the PMS fast to read without losing depth.
Crypto runs around the clock. The product had to support quick checks as well as longer analysis sessions, without splitting the experience into separate “lite” and “pro” surfaces.